
Some plots from statistics gathered by the new Stacks project website. The first 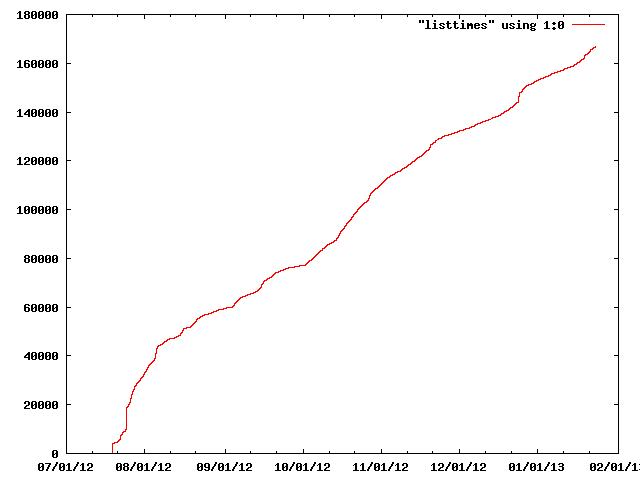 shows the number of times the google bot has been checking in over time (in total about 160000 times). The second
 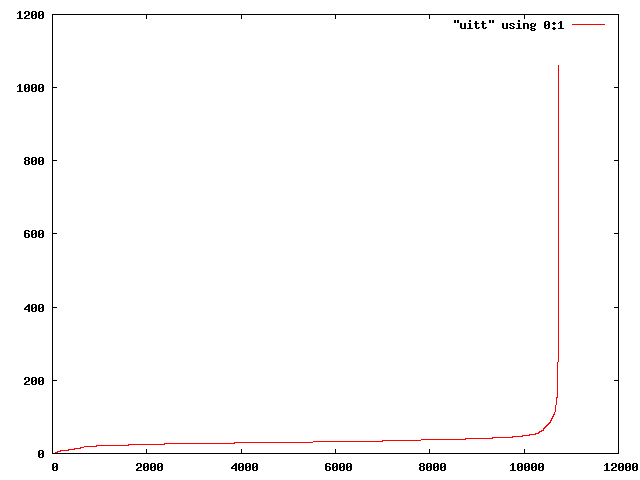 shows the cumulative count of tags looked up in the stacks project. This plot is a bit misleading. Precisely, there are
- 391 tags which have been looked up at most 10 times,
- 2377 tags which have been looked up at most 25 times,
- 10109 tags which have been looked up at most 50 times, and
- 10611 tags which have been looked up at most 100 times.
Unfortunately these numbers include hits from robots (mostly search engines). The most looked up tags are:
- 150 hits on 00GF
- 151 hits on 0138
- 153 hits on 002R
- 153 hits on 06J1
- 154 hits on 03T3
- 154 hits on 04T3
- 155 hits on 072X
- 156 hits on 005M
- 164 hits on 03JG
- 164 hits on 049D
- 165 hits on 01HX
- 172 hits on 01CV
- 177 hits on 0747
- 179 hits on 04PY
- 187 hits on 073Y
- 189 hits on 073X
- 190 hits on 014J
- 191 hits on 02EM
- 210 hits on 06LB
- 222 hits on 07K7
- 225 hits on 066A
- 226 hits on 00LN
- 229 hits on 04DG
- 242 hits on 0032
- 243 hits on 016P
- 255 hits on 000H
- 260 hits on 00FT
- 294 hits on 0200
- 327 hits on 052Q
- 499 hits on 0001
- 998 hits on 05G7
- 1040 hits on 04KU
- 1059 hits on 05LK
- 1059 hits on 06NN
- 1061 hits on 05YW
For some of these there doesn’t seem to be a good reason for them to be looked up more and so there must be some other reason why these get hit (i.e., the tag in question refers to something in “real” life).