Huge thanks to Pieter Belmans who did an enormous amount of work coding the stacks project website.
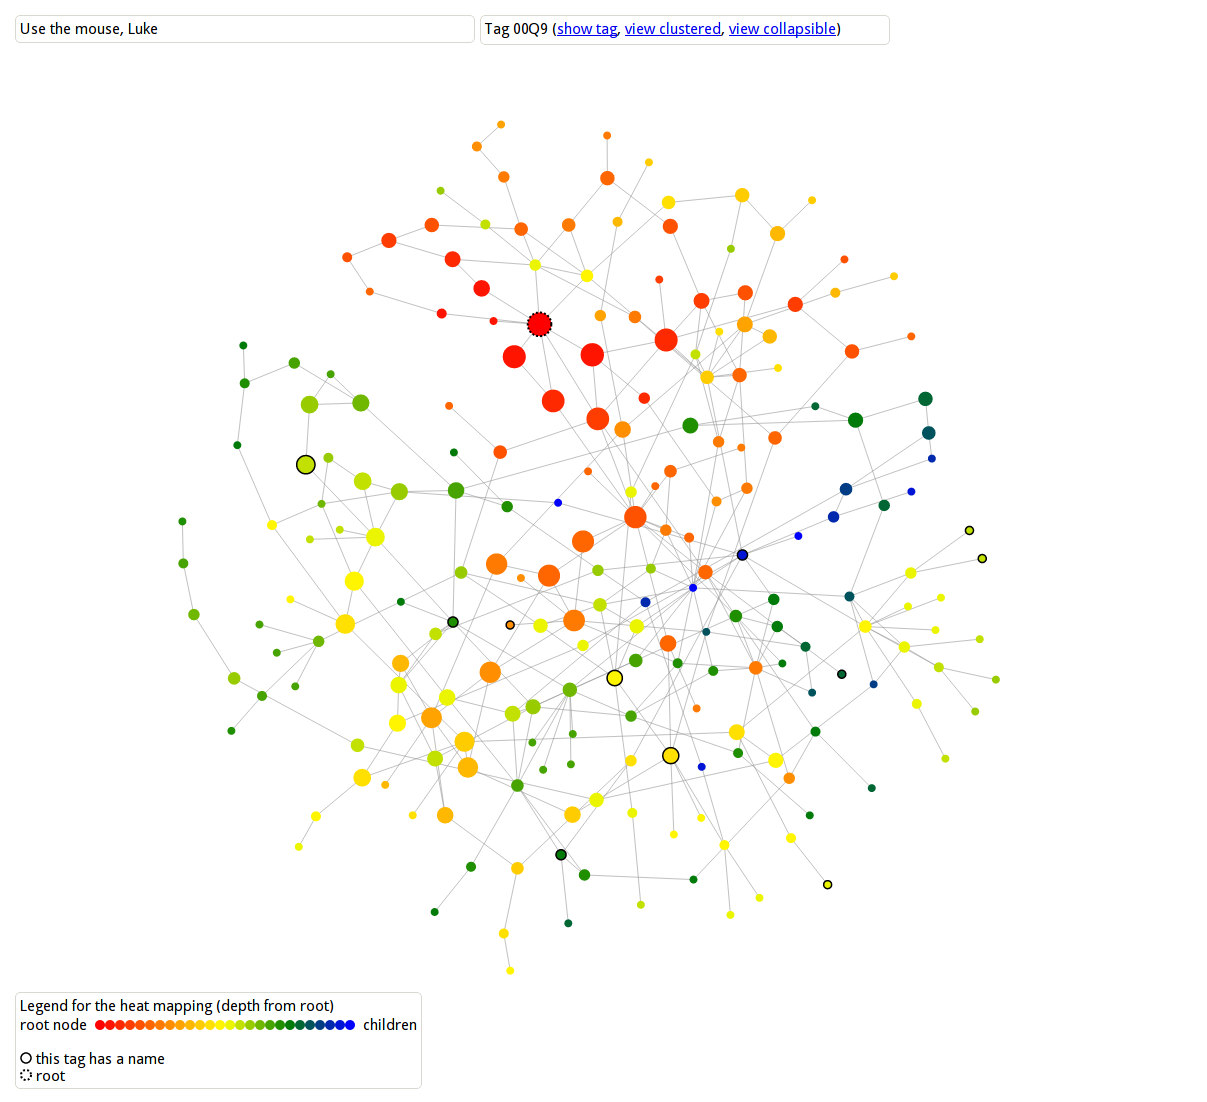
Please visit the new version of the website and play around. A major new feature is the dynamic creation of graphs vizualing the logical connections between results in the stacks project, for each and every result. Here is an example
Edit: To view a graph, browse the project online, choose a chapter, choose a section, choose a lemma, and then click on one of the three types of graphs.
If you have a comment, suggestion, etc then please come back here. If you find a bug in the operation of the website, then either leave a comment here, or email the maintainer, or create an issue on the github repository.
Enjoy!


When I go to the Stacks Project website as linked to here, I reach a page that gives no clue as to how to see the visualizations you mention.
Right, yes, that is silly! OK, edited the post. Thanks!